")

We missed the flight. What was the actual root cause?
A business trip. A ferry. A ramp that was too high. And a flight we never caught.
We were visiting a client in Meløy, about three hours south of Bodø.
Normally you can drive the whole way. But a landslide had blocked the road. The ferry from Meløy to Ørnes was the only way forward.
We thought we had plenty of time. It turned out we did not.
We underestimated how many others were also taking the same ferry. While we waited in the queue, a truck reversed into our car. We had to spend time filing a damage report.
We missed the scheduled ferry, but got on the extra one that was put into service.
When we finally arrived at Ørnes, we were told to drive off. But the ferry ramp was higher than the ferry deck. We drove, and got stuck on the undercarriage.
Several passengers had to help push the car free. We got going, but could only wave goodbye to our flight.
In brief
Situation: A business trip with delays, a damaged rental car and a missed flight. The incident had multiple simultaneous causes and effects, which makes it a useful example of the challenges in root cause analysis.
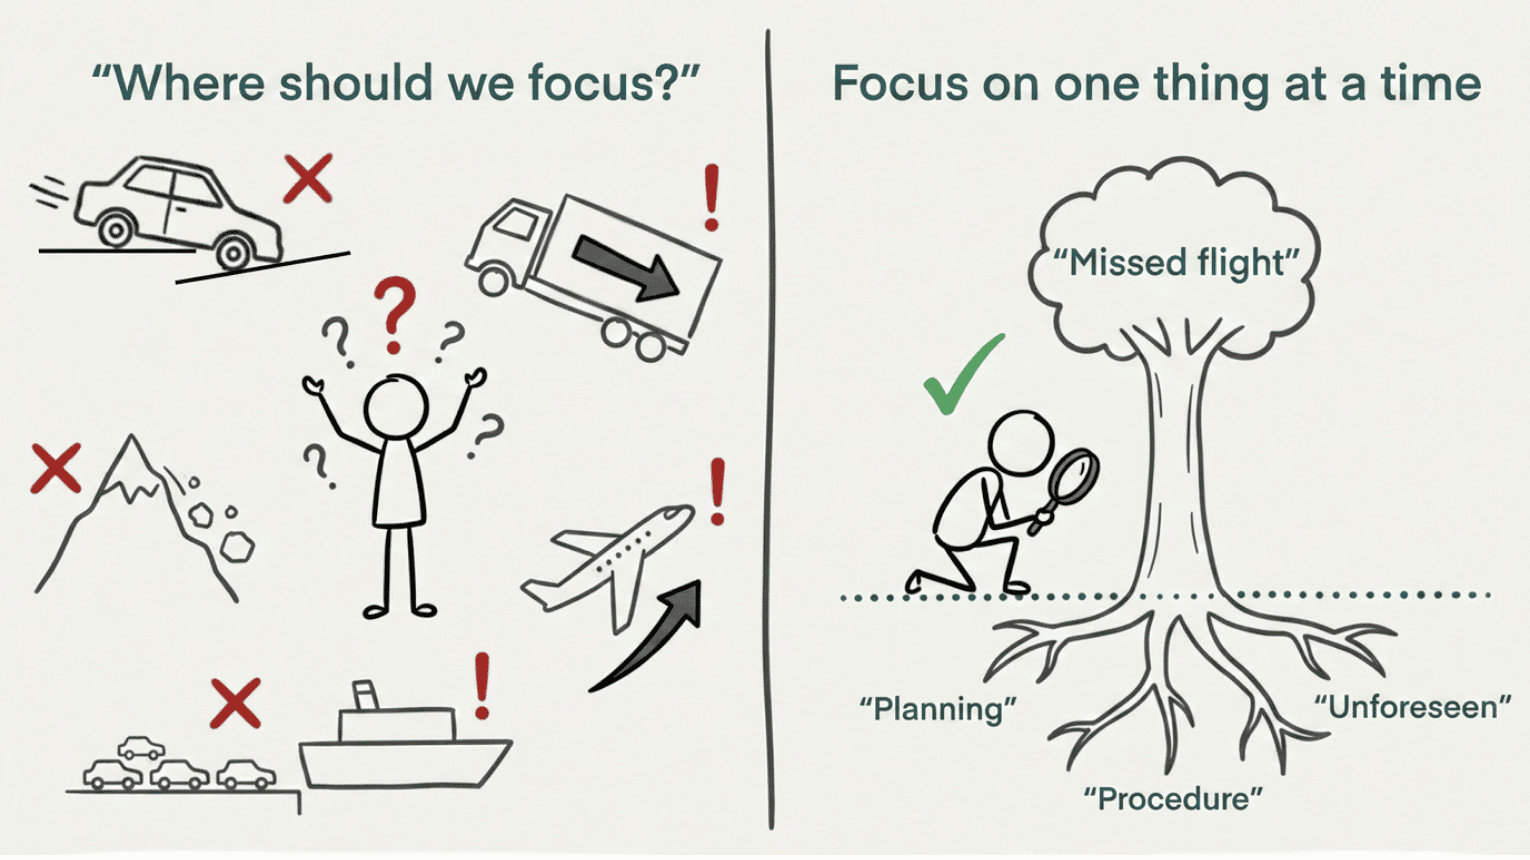
Insight: When many things happen at the same time, it is easy to lose focus. What are we actually analysing? The damage to the car? Missing the flight? The blocked road? Keeping focus on one thing at a time is critical, and harder than it sounds.
Signs to watch for: The team stops at the first explanation that makes sense. The analysis goes off track as new causes and effects emerge along the way. Actions target the last thing that went wrong, not what had the greatest effect.
Next step: Decide what the problem is before you start the analysis. Use 5 Whys to dig deeper into simple cause chains. Use the fishbone diagram to systematise possible causes and group related ones. But remember: the tools are only steps along the way.
The obvious cause is rarely the root cause
What this is about: Root cause analysis is about digging deeper than what is obvious. The first explanation that makes sense is rarely the last. And a fishbone diagram with many causes is not an analysis. It is a starting point for one.
Why it happens: We are used to acting quickly. When something goes wrong, we want to fix it and move on. It is tempting to stop at the first answer that makes sense. It is faster to point to one cause than to analyse the whole system. But simple explanations rarely produce lasting solutions.
How to recognise it:
- The team points to one cause instead of looking at the whole picture.
- Actions are implemented without anyone testing whether they address the right cause.
- The same problem comes back, with slightly different symptoms.
- Discussions end with "who messed this up?" instead of "how can we improve the process?"
- The fishbone diagram is filled in at a meeting and put in a drawer.
Structured tools help you ask better questions. But it is the questions that lead you to the root cause, not the tool itself.
5 Whys: curiosity as method
5 Whys is simple in theory: keep asking questions until you reach a cause you can actually do something about. It does not always have to be "why" — "what happened?", "what allowed this?" and "what was missing?" are equally useful questions.
For this incident, one cause chain could look like this:
Problem (the head of the fish): We missed the flight.
Question 1: We arrived at the airport too late.
Question 2: We left the ferry terminal too late.
Question 3: We were delayed by the ferry ramp incident.
Question 4: We were waved off the ferry too early by the crew.
Question 5: The drive-off procedure was not good enough. Possible causes: the procedure did not exist or was not followed, mechanical fault on the ramp or barrier, tidal changes or load distribution altered the ramp angle, missing clearance height check, communication breakdown between crew members.
But here is the trap: by following the last event in the chain, we end up optimising the process "driving off a ferry". That is outside our control. We would rather find learning that helps us catch the flight next time. That is about planning, not the ferry ramp.
5 Whys on complex problems can lead you in the wrong direction because the cause chain is not linear. You risk stopping at the last event in the chain instead of finding what actually had the greatest effect.
Fishbone diagram: systematising possible causes
Where 5 Whys gives you depth in one cause chain, the fishbone diagram helps you see the breadth. It organises possible causes into categories, for example Man, Method, Machine, Material, Milieu (Environment) and Measurement (often called 6M). This makes it easier to spot causes you would otherwise miss and to group related causes together.
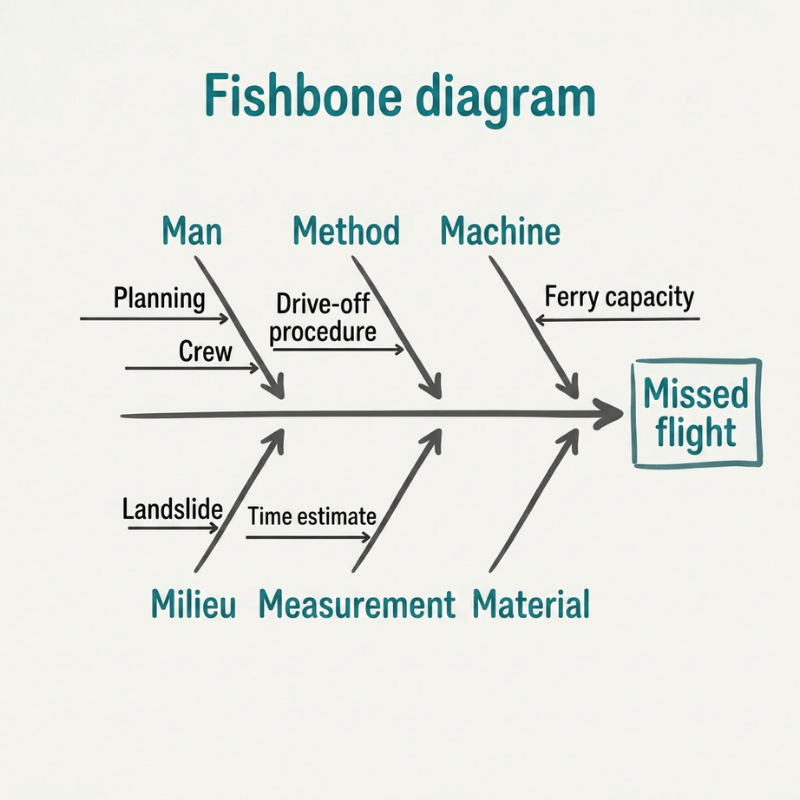
For the ferry incident, it could look like this:
Man: Planned departure time (consultants), timing of drive-off from ferry (crew), blind spot check before reversing (truck driver).
Method: Drive-off procedure, road safety during landslide.
Machine: Ferry capacity (we missed the scheduled ferry).
Environment: Landslide blocking the road.
Measurement: Time calculation for catching the ferry.
Note that "Material" is not relevant here. The categories are a tool for broad thinking, not a checklist that must always be completed.
An alternative to 6M is to use the process steps as categories. This organises causes by where in the process they arise, making it easier to link cause to action. My personal preference is to draw a process map rather than fill in a fishbone diagram, because it forces a shared understanding of what actually happens in the process before we discuss causes. Read more about how to choose the right tool in Carrot or tree?
Do you recognise this?
Maybe you are not analysing ferry trips right now. But I bet you recognise the dynamic:
- The analysis goes off track because the team discovers many simultaneous causes and effects and loses focus on what the actual problem is.
- 5 Whys is used on a complex problem with many simultaneous causes, and ends with you optimising the wrong thing.
- A non-conformance occurs, the fishbone is filled in at a meeting, and nothing happens afterwards.
- Actions are implemented because they "always worked before", without anyone testing whether they address the right cause this time.
- The same problem is solved three times in one year, and no one asks why it keeps coming back.
The consequence? Resources are spent on actions that do not solve the underlying causes. The same fires are put out again and again.
What you can do
Step 1: Decide what the problem is before you start
The head of the fish is what you are analysing. Is it the damage to the car? Missing the flight? The blocked road? Choose one focus. Causes that are relevant for one problem may be irrelevant for another. And when you find a possible cause: would the problem disappear if this cause did not exist? If not, it may not be the root cause.
Step 2: Use 5 Whys to dig deeper
Keep asking questions until you reach a cause you can actually do something about. But be aware: on complex problems with many simultaneous causes, 5 Whys can lead you in the wrong direction. In those cases, the fishbone diagram or a process map is a better starting point.
Step 3: Use the fishbone diagram to see the full picture
Fill in possible causes across the categories. Involve people who know the process. An operator who has worked in the process for five years often knows more than what appears in the non-conformance report. Consider whether the process steps are better categories than 6M for your problem.
Step 4: Prioritise and test the hypotheses
For each possible cause: what data would confirm or rule this out? Choose the causes you can actually influence and that have the greatest effect. Test, learn and adjust. Root cause analysis is an iterative process, not a one-time exercise.
Frequently asked questions
When should I use 5 Whys and when the fishbone diagram?
Use 5 Whys when the cause chain is simple and linear. Use the fishbone diagram when the problem has many possible causes or involves multiple parts of the system. Combine them if useful: 5 Whys for depth in one branch, fishbone for breadth. But both are only steps along the way, not the goal itself.
What do we do when the fishbone diagram is complete?
That is where the important work begins. Prioritise the hypotheses. Which causes can you actually influence? Which have the greatest effect? Decide what to test, collect data, and evaluate whether the action works. Without this step, the fishbone is just a well-organised list.
Can I use a process map instead of a fishbone diagram?
Yes, and often it is a better choice. A process map forces a shared understanding of what actually happens in the process before you discuss causes. It makes it easier to see where in the process causes arise and to link them to concrete actions. Read more about how to choose the right tool in Carrot or tree?
What if we disagree on the root cause?
Then you need data. Discussions about root causes without data become exchanges of opinion. Use the fishbone diagram to list hypotheses, test them systematically, and let the data decide, not the loudest voice in the room.
Can root cause analysis be used on all types of problems?
5 Whys and the fishbone diagram work best on problems that occur rarely (special cause variation). If the problem occurs frequently and randomly, you need to understand the process better. Read more about the difference in the article Carrot or tree?
Want more problem-solving stories?
This story is from our weekly newsletter, where we share experiences. Short stories for those who want to solve problems at the root and achieve measurable, lasting value.
Sign up for our newsletter:
If you want to learn more about the topics in this post:
• Shared focus first: how to ensure the team is solving the same problem
• Carrot or tree: choose the right tool for the right type of problem
• Understand the difference between noise and signal with statistical process control
Assignments
Contact info
Lean Tech AS | Kristoffer Robins vei 13
0047 481 23 070
Oslo, Norway
Lean
L - Look for solutions
E – Enthusiastic
A – Analytical
N - Never give up