")


SPC Course: Statistical Process Control
Do you overreact to normal variation? And do you notice when something unusual actually happens in your process?
SPC gives you a shared language and a clear method for responding correctly to what is actually happening in your processes.
Format: E-learning (~1.5 hours) with certificate upon passing the quiz.
Over 360 people have taken SPC training with us.
Who is this for?
This course is for you if you:
- Work with measurement data and want to respond correctly to what is actually happening in your process.
- Find that adjustments and corrective actions don't stick, and wonder why.
- Are responsible for quality, production, or process improvement.
- Want to understand what drives variation in your processes and reduce it.
- Are new to SPC or want to refresh your knowledge with practical examples.
"Manage the cause, not the result." — W. Edwards Deming

Includes certificate
What will you get out of this?
- Respond correctly to measurement results by using control charts.
- Understand what drives variation in your processes through process variable mapping.
- Create and interpret control charts for individual values.
- Assess process stability and capability (CpK) — is your process meeting customer requirements?
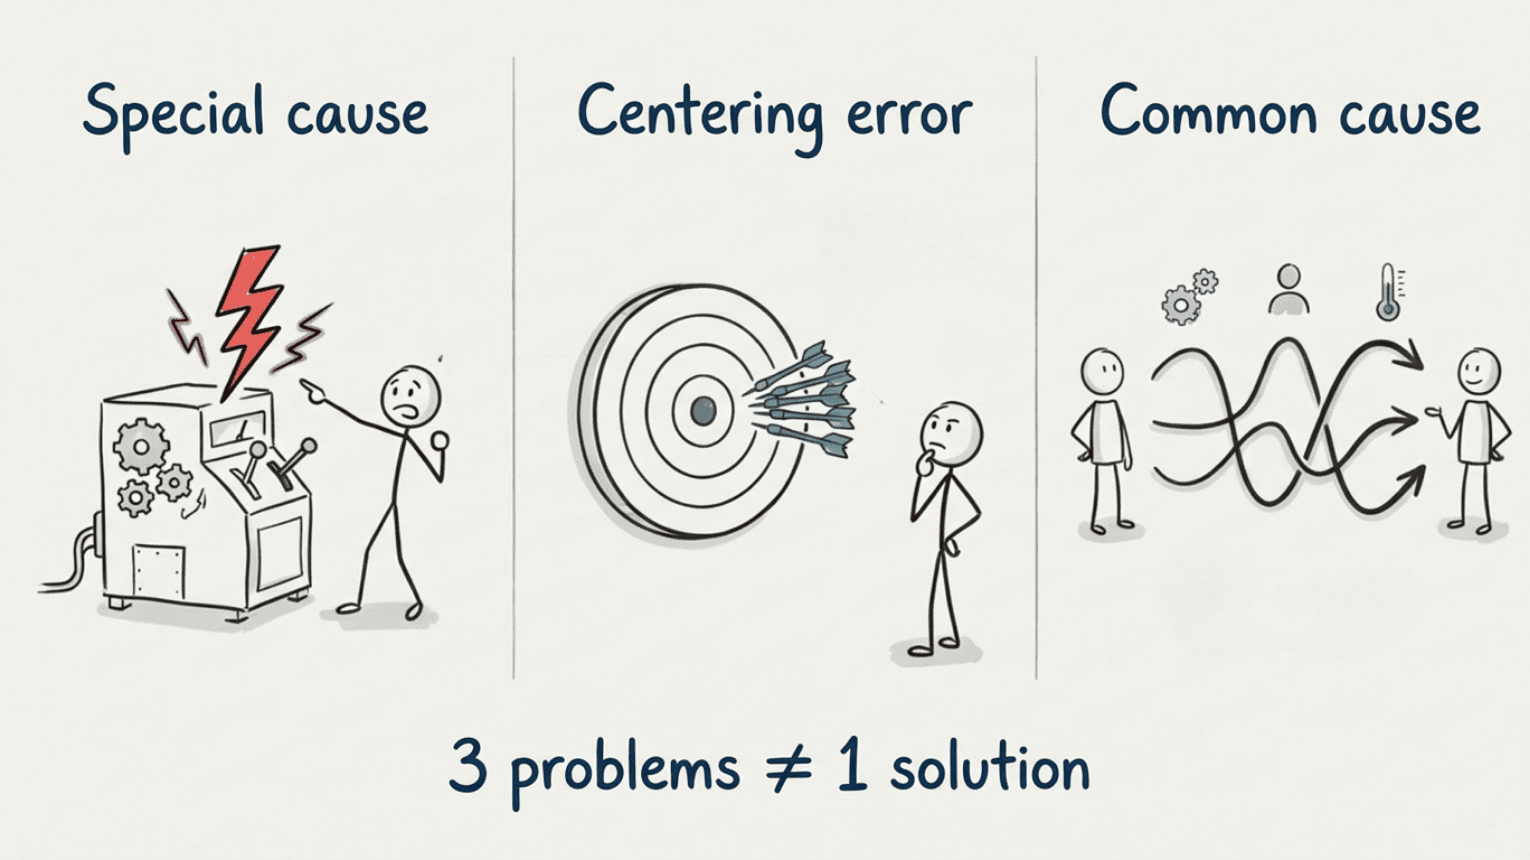
- Diagnose the right problem: wrong centring, too much normal variation, or a special cause event?
- Certificate when you complete all videos and pass the quiz.
What participants say
"The SPC course was the most valuable for me. Being able to do process mapping and document our processes has helped both me and my team in our daily work. We are a much more robust team."
Johannes Sletteskog, SPC course
"Very clearly explained. It opened my eyes to not overreacting to normal variation, and to how to reduce variation."
"Great exercises. Relevant and relatable. A skilled and engaging instructor."
"A very engaged instructor who takes a genuine interest in each participant's work challenges."

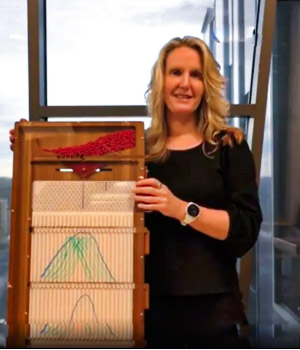
Galton board
How the course works
The course consists of 11 videos you complete at your own pace, with exercises, course documentation, and access for 1 year from registration.
We use a Galton board to demonstrate variation with and without adjustment. It gives you an eye-opening moment when you see for yourself that variation increases when you over-adjust.
- Understanding variation (~24 min): Process variable mapping and types of variation.
- Control charts (~41 min): Creating and interpreting control charts, understanding probability, and responding correctly based on type of variation.
- Capability (~24 min): Is your process meeting customer requirements? How capable is it (CpK)? Choose the right approach to improve.
- SPC quiz, certificate and practical real-world examples.
Introduction (2 min)
Module 1: Understanding variation
- Process variable mapping (17 min)
- Types of variation (7 min)
Module 2: Control charts
- Creating control charts (15 min)
- Interpreting control charts (7.5 min)
- Understanding probability (10 min)
- Responding correctly (8.5 min)
Module 3: Capability
- Problem-solving strategy (13 min)
- Capability (10.5 min)
Summary (4 min)
SPC quiz
10 multiple-choice questions. Unlimited attempts. Pass and download your certificate.
SPC in practice (bonus)
Real-world examples, including an introduction to SPC from Lean Tech's advent calendar.
What is SPC and why do I need it?
SPC (Statistical Process Control) helps you separate normal from special cause variation in measurement data based on probability, not guesswork. It helps you respond correctly: should you look for a specific cause, or reduce variation in the system? You avoid overreacting to normal variation (which makes things worse) and stay alert to special events you can learn from.
Do I need prior knowledge of statistics or Lean Six Sigma?
No. The course is designed for anyone who wants to interpret measurement results correctly, regardless of background. We start with the fundamentals and build gradually with practical examples.
What is the difference between normal and special cause variation?
Normal variation is always present in a process — small fluctuations in temperature, materials, or equipment, for example. Special cause variation is an unusual event that stands out, for better or worse, and is worth investigating. SPC helps you tell the difference.
How much time do I need to set aside?
The course takes approximately 1.5 hours in total. You can start whenever you like and work through the videos at your own pace. You have access for 1 year.
What is included in the price?
Access to all video modules (~1.5 hours), course documentation, exercise files, bonus content, and a certificate upon passing the quiz. Access for 1 year from registration.
Will this work for my industry?
Yes. SPC applies across all industries where you work with measurement data, because the method is about variation in processes, not specific products. Participants come from manufacturing, healthcare, food production, the public sector, and more.
Do I receive a certificate?
Yes. You download your certificate once you have completed all videos and passed the quiz. The quiz has 10 multiple-choice questions and you have unlimited attempts.
These articles explore the topics covered in the course:
- Are you overreacting to normal variation? — what happens when you adjust what is actually just normal noise.
- Before you choose a tool: carrot or tree? — matching the right approach to the right type of problem.
- Robust processes with Statistical Process Control — the three most common problem types and why the wrong diagnosis leads to the wrong fix.
Your instructor
Sissel Pedersen Lundeby: 20+ years of SPC experience • IASSC-accredited instructor • MSc Chemical Engineering • Black Belt since 2002:
"SPC is the tool that has made the biggest difference in my improvement work. Everywhere I look, I see people overreacting to normal variation — it makes processes worse, wastes time, and costs money. Building robust processes that consistently meet customer requirements takes a solid understanding of variation. SPC gives you that understanding."

Assignments
Contact info
Lean Tech AS | Kristoffer Robins vei 13
0047 481 23 070
Oslo, Norway
Lean
L - Look for solutions
E – Enthusiastic
A – Analytical
N - Never give up