")

Detection Is Not Prevention – and FMEA Doesn't Know the Difference
Production increased. Scrap costs rose. Month after month. The all-important RPN score in FMEA stayed the same.
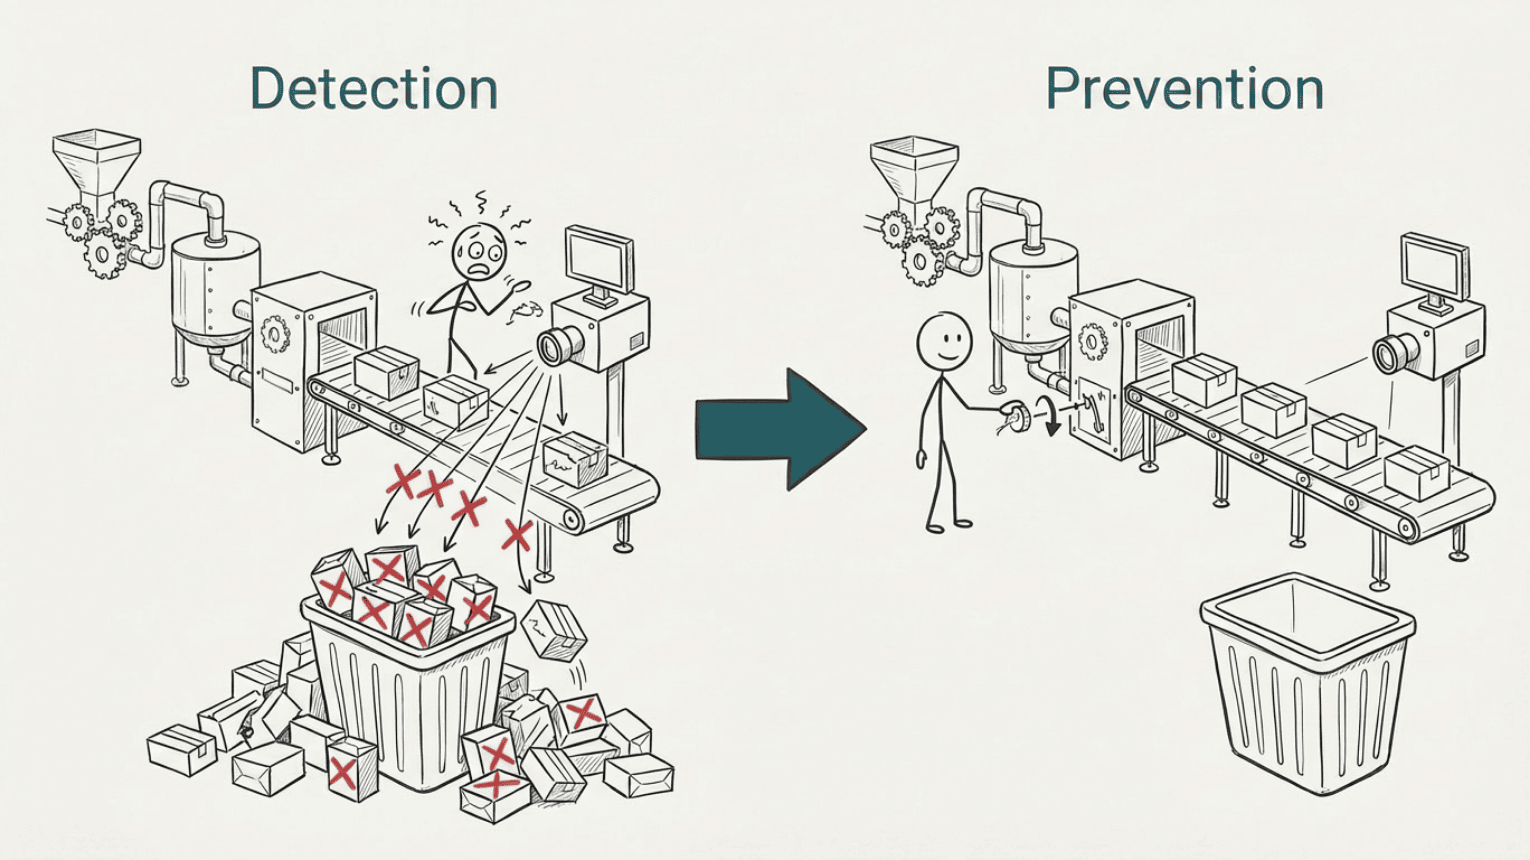
A pharmaceutical manufacturer had invested in advanced camera inspection systems to make sure no defective product left the facility. The system worked. 70 inspection points did their job. They caught defects.
But it also rejected products that were perfectly fine.
The camera system was not always stable – it varied in itself. And the acceptance criteria had been set tight. Just to be "on the safe side". The work of setting the right tolerances remained undone. The causes of defects remained unresolved.
The team had followed the book. The FMEA (Failure Mode and Effects Analysis) was thorough. The detection score was good. RPN (Risk Priority Number) was low.
And that was exactly where the problem was.
What is FMEA?
FMEA, Failure Mode and Effects Analysis, is a risk analysis tool. It is used to identify potential failures in a process or design, assess the consequences, and prioritise actions to reduce risk. FMEA is used in industries where failures can have serious consequences: pharmaceuticals, food production, defence, and automotive, to name a few.
Traditional FMEA uses RPN, Risk Priority Number, calculated as severity × frequency × detection. A high detection score (i.e. good systems for catching defects) gives a lower RPN and therefore lower priority.
That sounds logical. But it can point focus in the wrong direction.
When detection replaces prevention
Back to the pharmaceutical manufacturer. The camera system detected defects. But the defects occurred because something was wrong earlier in the process.
The cause was never eliminated. It was only detected.
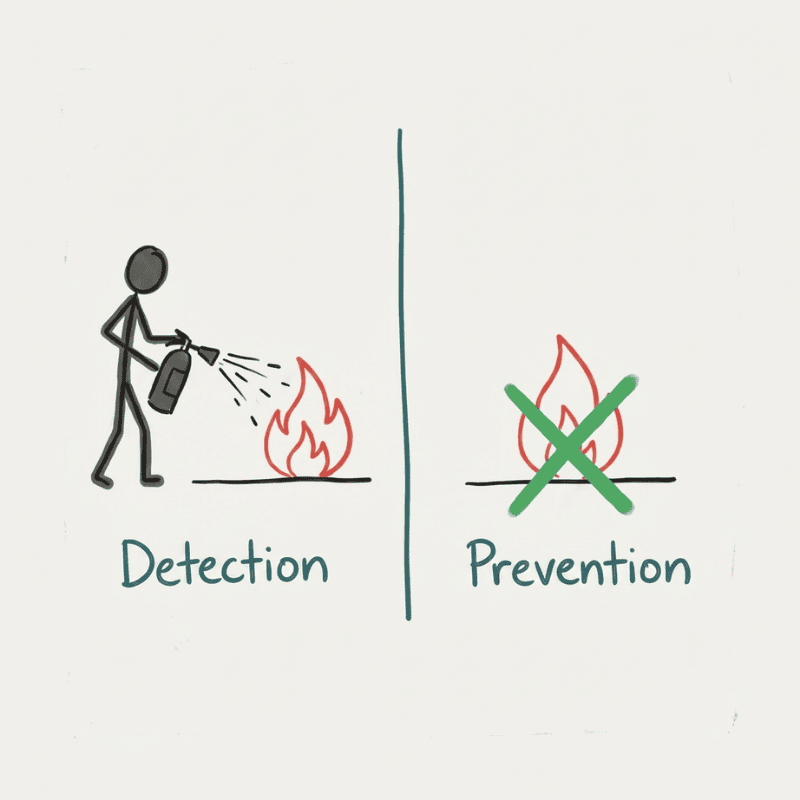
Detecting a defect is not the same as preventing its cause. It is like fighting fires instead of removing what starts them. If you eliminate the cause, you do not need to detect the defect.
The RPN model has a built-in weakness here: it weights detection as heavily as frequency and severity. This means a good camera system can "mask" a real problem in the analysis, and the action plan ends up pointing toward better detection – not toward removing what creates the defect in the first place.
When too much detail kills the overview
A customer in the defence industry, new to FMEA, wanted to be thorough. We started with a 140-page procedure and worked through each activity step by step.
It did not take long before we had lost the overview.
Too much detail too early gives you exactly that: a lot of information and little understanding of what actually matters.
I suggested process variable mapping instead. Identify the main activities. Define the purpose of each one. Use failure statistics to prioritise where it is worth digging deeper – and skip the rest.
This does something important: the outcome measures show whether the purpose of each process step is being met, and the variables that influence the outcome become natural candidates for root cause analysis. The distinction between cause and effect follows naturally.
The team agreed with the approach. The challenge was that they did not have the failure statistics available. That data had to be collected before we could prioritise which process steps actually deserved attention.
When preparation is solid – but the meeting runs too long
Good preparation is essential for effective FMEA meetings. With one customer, the preparation was thorough.
We had defined the processes in advance. We had agreed on scales for severity, frequency, and detection. Suppliers came and demonstrated machines and equipment. We used slow-motion videos so the team could clearly picture what kinds of failures were possible.
All of that was good. But the first meeting still ran too long. Too much time spent on details where the risk was not.
In the second meeting we simplified. It moved faster. But we risked oversimplifying something that actually mattered.
The lesson: start at a high level, use data to narrow focus where the risk actually is. Do not dig into detail everywhere. Dig where there is reason to.
When the team lacks the right perspective
A supplier to the aviation industry had an FMEA team dominated by designers. Production was rarely in the room. The analysis pointed to failures in production.
No surprise there.
When the designers visited the customer, they discovered that many non-conformances had never been reported. The customer had found local workarounds and did not bother logging issues they handled themselves. A significant share of what was reported turned out to have its root cause in the design itself.
FMEA without the customer perspective and without a cross-functional team gives a skewed picture. It easily becomes a blame game – production points at design, design points at production – and no one sees the system they are both part of.
In short
Situation: Four different industries, the same underlying problem. The FMEA pointed toward detection rather than prevention, the team was unbalanced, and the level of detail was chosen too early.
Insight: The RPN model rewards detecting defects as much as preventing their cause. Without the right prioritisation, time is spent on the wrong details – and important findings disappear because time runs out.
Learning: Severity and frequency are sufficient grounds for prioritisation. Detecting a cause is not the same as detecting a defect. And without production, design, and the customer in the same room, you get a skewed picture of where the risk actually lies.
Practical tips: Start with a process map and function. Use capability and severity to prioritise. Dig into the variables that affect the prioritised process steps. Implement preventive actions – not detection actions.
What AIAG-VDA changed – and what is still missing
The AIAG-VDA standard from 2019 was developed to harmonise two different traditions – the American (AIAG) and the German (VDA). Primarily for the automotive industry, but the structure works well for complex industry in general.
The standard defines seven steps: Planning & Preparation, Structure Analysis, Function Analysis, Failure Analysis, Risk Analysis, Optimization, and Results Documentation.
The function-oriented starting point is the most important contribution: what is this activity supposed to achieve? If it does not achieve that, what happens? This aligns directly with process variable mapping and is a better entry point for FMEA than starting with a list of things that could go wrong.
AIAG-VDA replaced RPN with Action Priority (H/M/L) based on tables. It is a step in the right direction, but not the whole way. In my view, severity and frequency should be sufficient grounds for prioritisation. And actions should be directed at detecting the cause early and working preventively – not at catching the defect at the end and throwing the product in the scrap bin.
A process with good prevention (low frequency) and a process with good detection get the same score in the RPN calculation. That means investing in better detection is rewarded equally to eliminating the cause. Even though the risk of a defect reaching the customer is greater when the defect has actually occurred.
FMEA also does not clearly distinguish between detecting a cause and detecting a defect. That is a significant difference. If you detect the cause before it produces a defect, you can stop it. If you detect the defect after it has occurred, the scrap cost is already there.
FMEA and statistical process control
FMEA lists causes in isolation and assesses frequency for one cause at a time. But many defects are not the result of a single identifiable cause. They are the sum of many things that together create too much system variation.
The machine may be designed for more variation than the customer requirements allow. The procedure gives too wide a tolerance. Settings need to be between 0.30 and 0.35, not 0.25 to 0.40. This is not captured by FMEA alone – it requires SPC and capability assessment.
SPC, Statistical Process Control, distinguishes between two types of variation: system variation, the normal variation that is always present in a process, and special causes, abnormal events where something specific has occurred. For special causes, root cause analysis is more straightforward because you can point to a concrete event. System variation requires a different approach.
With SPC you can calculate capability – and capability is the same as the risk of producing defects. A process with low capability frequently delivers outside tolerance. High capability means the process consistently delivers within tolerance. Probability of defect = capability = frequency in FMEA terms.
This means you can use process variable mapping and capability data to prioritise which process steps need attention in FMEA. Prioritise steps with high frequency and high severity. Dig deep there to understand what drives system variation. Variables that contribute to variation in the outcome are candidates for the FMEA analysis.
An important question for each variable: is it controlled, or does it vary randomly (noise)? The key to robust processes is that the most important variables are under control. If a critical variable varies randomly, or you allow too much variation, it produces frequent defects – regardless of what the rest of the process does.
Combining FMEA and SPC in the same risk assessment process is not common practice today. It should be.
Does this sound familiar?
- The FMEA is thorough, but the action plan is mostly about better detection – rarely about removing the cause.
- Meetings run too long, and it is unclear what was actually resolved.
- Production is rarely represented when design and process are discussed.
- You know the customer handles non-conformances locally without reporting them.
- The RPN table is large. The prioritisation is unclear.
If you recognise more than two of these, the problem is probably not the FMEA template.
It is the approach.
What you can do differently
Step 1: Start with a process map and function
Define the main activities in the process and the purpose of each one. What is this process step supposed to achieve? That gives a better overview than starting with a list of things that could go wrong.
Step 2: Use SPC on outcome measures and determine capability
Capability is the same as the probability of producing defects – and frequency in FMEA terms. A process with low capability frequently delivers outside tolerance. That is where the risk actually is.
Step 3: Get the right team together – and invite the customer
Include production, design, and the customer (or a customer representative) in the FMEA work. Non-conformances that are not reported are still non-conformances – and causes that are not seen by everyone in the room will not be found.
Step 4: Prioritise based on capability and severity
These two factors are sufficient grounds for prioritising which process steps need attention. Dig into detail there – and skip the rest.
Step 5: Map the variables that affect the prioritised process steps
The variables that influence the outcome are the candidates for root cause analysis. A key question for each variable: is it controlled, or does it vary randomly? Important variables that vary without control produce frequent defects, regardless of what the rest of the process does.
Step 6: Implement preventive actions
The goal is control and acceptable variation in the most important variables. Not better detection of defects that have already occurred. If you eliminate the cause, you do not need to detect the defect.
Step 7: FMEA is not a one-time job.
Findings from root cause analyses should be continuously incorporated into the FMEA document. Treated as a living document, FMEA becomes a tool for continuous improvement – not a report filed away after the project.
Frequently asked questions
What is the difference between Design FMEA and Process FMEA?
Design FMEA (DFMEA) looks at potential failures in the product design, before production starts. Process FMEA (PFMEA) looks at failures that can occur in the production process. Both use the same basic structure, but the failure modes and actions differ. In practice they are more closely linked than many assume: causes attributed to production often turn out to lie in the design.
What is RPN, and what is the problem with it?
RPN is Risk Priority Number, calculated as severity × frequency × detection. The problem is that detection is weighted as heavily as frequency and severity. A process with frequent, serious failures can get a lower RPN than a process with less frequent, less serious failures, simply because the detection system is good. That means the action plan points toward better detection rather than removing the cause. The AIAG-VDA standard from 2019 replaced RPN with Action Priority (H/M/L), but in my view severity and frequency alone should be enough to prioritise.
What is AIAG-VDA FMEA?
AIAG-VDA FMEA is an updated standard from 2019 that harmonises the American and German approaches to FMEA. It introduces a function-oriented 7-step model and replaces RPN with Action Priority. The standard was developed for the automotive industry, but the structure is relevant for complex industry in general.
Two contributions stand out. The first is the function-oriented starting point: what is the process step supposed to achieve? That is a better entry point than starting with a list of things that could go wrong, and it makes it easier to understand complex relationships between system, subsystem, and component.
The second is a stronger focus on preventive controls rather than detection controls. Action Priority weights severity and frequency more heavily than detection – that is a real improvement over RPN.
How do I connect FMEA to statistical process control?
The probability of producing defects is the same as capability. A process with low capability frequently delivers outside tolerance – that is high frequency in FMEA terms. Use capability data to prioritise which process steps need attention, and dig deep there to understand what drives variation. Variables that contribute to variation are included in the FMEA. A key question for each variable: is it controlled, or does it vary randomly? Important variables that vary without control produce frequent defects, regardless of what the rest of the process does.
How detailed should an FMEA analysis be?
Detailed enough to make the right decisions – no more. A common mistake is to start too detailed and lose the overview. Start at a high level, identify the most important activities and their purpose, then use failure statistics and capability data to identify where it is worth going deeper.
What is the difference between FMEA, FMECA, and HAZOP?
All three are methods for analysing and reducing risk, and they overlap significantly. FMEA (Failure Mode and Effects Analysis) is the most widely used and is the starting point for the other two. FMECA adds a criticality assessment – a weighting of how critical each failure mode is. HAZOP (HAZard and OPerability study) is used primarily for process plants and piping systems, and is especially common in the oil and gas industry. In practice, FMEA is often used as a common term for all three.
Would you like to discuss risk assessment in your process?
These cases are from my own projects, in pharmaceuticals, defence, food production, and medical devices. Every project is different, but the patterns are often the same.
If you want to look at how FMEA, process variable mapping, and statistical process control can be applied in your situation, we can have an informal conversation:
If you want to read more about the topics in this post:
• FMEA as a service – how Lean Tech works with risk assessment in complex industry
• The problem was not the process – on measurement systems and variation you cannot trust
Assignments
Contact info
Lean Tech AS | Kristoffer Robins vei 13
0047 481 23 070
Oslo, Norway
Lean
L - Look for solutions
E – Enthusiastic
A – Analytical
N - Never give up