")


I was very impressed with Sissel's Lean Six Sigma knowledge. She makes it easy to identify improvements and create results.

Daryl Powell
Research Manager, Sintef Manufacturing
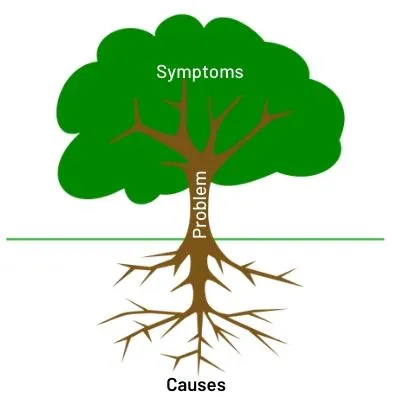
The purpose of a root cause analysis is to determine the true causes of a problem to implement targeted measures.
As the picture illustrates, a problem (the tree) can have many causes (roots). Over time, the symptoms (leaves of the tree) and the problem (tree) grow larger and become more and more visible.
It's important to see the tree behind the leaves. Focusing on the leaves - symptoms, makes it difficult to identify the true root causes. If you treat symptoms without addressing root causes, symptoms will reappear.
An example is taking painkillers if you have a fever. The fever (symptom) is reduced, but the root causes are not addressed. If the fever is caused by an infection, you must solve the root cause to become recovered.
There are similar examples where we solve symptoms without adressing the root cause. If the root cause remains unsolved, symptoms will reappear.
The causes of a problem can be complex and due to several factors. How often does it occur? Is it a single event?
The frequency of the problem is crucial when deciding problem solving strategy.
Statistical Process Control (Control Charts) separates normal and special cause variation. To succeed with your root cause analysis, it is crucial to know if it the problem is due to normal or special cause variation.
If the problem is due to special cause variation, you can look for one or more abnormal events. Once you have found the abnormal event (s) you can take corrective action.
Normal variation is the sum of variation from all variables that affect the process. To reduce normal variation, it is important to identify which variables affect the process. A process mapping helps you with that.
Once you know which variables affect the process, you can use various graphical analyzes or hypothesis testing to determine what is critical. Then, reduce the variation of the critical variables, monitor and control them.
If you react to normal variation as if it was special cause variation, you will probably make things worse.
Here are some tools to help you with Root cause analysis:
These tools are used within Lean Six Sigma's problem-solving method DMAIC: Define (understand problem and set goals) - Measure (map current situation) - Analyze (prove root causes) - Improve (solve root causes) - Control (create lasting results).
I was very impressed with Sissel's Lean Six Sigma knowledge. She makes it easy to identify improvements and create results.
Very nice and professional service. Delivered a good job within deadlines.
Sissel's commitment and expertise is impressive. Her contribution to our monitoring program has been precise and targeted, as well as very educational.
We are very happy with the work carried out; with your background and expertise, the outcome was what we were looking for.
Sissel is a competent and committed employee. She has been an important contributor to ensure progress. At the same time, she is accurate and deliveres good quality work.
Lean Tech delivered monitoring program for air emission. The assignment was delivered with the correct content at the right time. Recommended.
Very engaged and focused throughout the course. Sticking to the agenda. Nice and pleasant.
Very good at keeping the right atmosphere, and at driving the participation from all the attendees.
Supply Chain & Automation Manager
"You are inspiring, positive and professionally skilled" "Made a difference, engaged and skilled"
"Inspiring, motivating and patient. Managed to adjust the subject to our level."
"Very knowledgeable. Good answers to all input."
"Excellent! Very clever and engaging"
"Great and fun with the Lego competition."
"Very good! Lots of knowledge and good at communicating."
"Good mix of theory and practice. Fun to try out what you've learned."
Very useful with practical implementation and approach, and that we could relate / transfer to our own workplace.
Inspiring, professionally competent, popularize a theoretical discipline.
Clear and well presented. Good at asking questions and listen (check understanding).
Academic highly skilled and clear performance. Fun and builds trust.
Lean Tech AS | Kristoffer Robins vei 13
0047 481 23 070
Oslo, Norway
L - Look for solutions
E – Enthusiastic
A – Analytical
N - Never give up


