")


I was very impressed with Sissel's Lean Six Sigma knowledge. She makes it easy to identify improvements and create results.

Daryl Powell
Research Manager, Sintef Manufacturing

Have you ever seen a measurement result and immediately thought something was wrong?
Maybe the scale showed one kilogram more than expected, or production data indicated a slight increase in defect rates? But what if this was just normal variation – what happens if you start making adjustments?
Do you rely on facts or intuition when interpreting measurement changes? Do you let random fluctuations dictate the adjustments you make in production?
All processes have natural fluctuations, and it is important to distinguish between normal variation and special variation before taking action.
Are you overreacting to normal variation? Unnecessary adjustments can actually increase variation and make the process more unstable!
Let’s say you weigh yourself a few weeks apart, and this time the scale shows 1 kg more than last time. Have you actually gained weight, or is this just natural variation?
To find out, we need to ask a few important questions:
To answer these questions, we can conduct a Component of Variation (CoV).
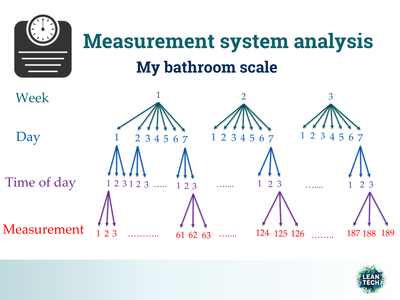
To understand weight variation, I conducted a CoV analysis over three weeks. I measured three times a day, taking three readings each time. This resulted in a total of 189 measurements, as illustrated below:
How do we analyze these measurements? Control charts help us determine expected variation.
To quantify how much variation is caused by measurement differences, we can use a Control Chart with subgroups (subgroup size = 3, since we have three parallel measurements). In this case, the control limits represent expected variation for three parallel measurements, i.e., measurement uncertainty.
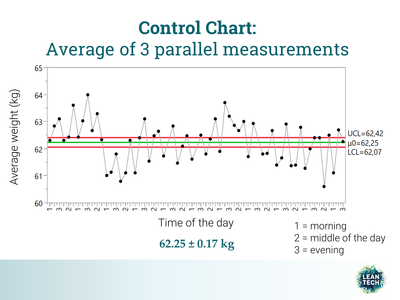
Interpretation:
To see how weight fluctuates throughout the day, we created another control chart using the average of the nine daily measurements:
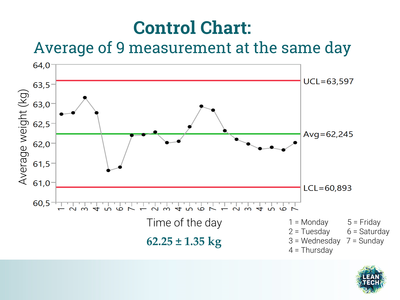
Interpretation:
All daily averages are within the control limits. This means that variation within a single day can explain differences between days. If we only compare two measurements without considering this variation, we might misinterpret changes.
This is a great example of how control charts can help us interpret variation and avoid incorrect conclusions. In production, misinterpreting variation can lead to unnecessary adjustments that make processes unstable.
🚀 Take the next step with our online SPC course!
I was very impressed with Sissel's Lean Six Sigma knowledge. She makes it easy to identify improvements and create results.
Very nice and professional service. Delivered a good job within deadlines.
Sissel's commitment and expertise is impressive. Her contribution to our monitoring program has been precise and targeted, as well as very educational.
We are very happy with the work carried out; with your background and expertise, the outcome was what we were looking for.
Sissel is a competent and committed employee. She has been an important contributor to ensure progress. At the same time, she is accurate and deliveres good quality work.
Lean Tech delivered monitoring program for air emission. The assignment was delivered with the correct content at the right time. Recommended.
Very engaged and focused throughout the course. Sticking to the agenda. Nice and pleasant.
Very good at keeping the right atmosphere, and at driving the participation from all the attendees.
Supply Chain & Automation Manager
"You are inspiring, positive and professionally skilled" "Made a difference, engaged and skilled"
"Inspiring, motivating and patient. Managed to adjust the subject to our level."
"Very knowledgeable. Good answers to all input."
"Excellent! Very clever and engaging"
"Great and fun with the Lego competition."
"Very good! Lots of knowledge and good at communicating."
"Good mix of theory and practice. Fun to try out what you've learned."
Very useful with practical implementation and approach, and that we could relate / transfer to our own workplace.
Inspiring, professionally competent, popularize a theoretical discipline.
Clear and well presented. Good at asking questions and listen (check understanding).
Academic highly skilled and clear performance. Fun and builds trust.
Lean Tech AS | Kristoffer Robins vei 13
0047 481 23 070
Oslo, Norway
L - Look for solutions
E – Enthusiastic
A – Analytical
N - Never give up


