")

Root Cause Analysis: From symptoms to lasting results
They worked harder. Hired more people. Worked overtime. The problem came back. Again and again. Because they never found the cause.
Treating symptoms gives temporary relief. Solving root causes gives lasting results.
Background
A manufacturing company had low productivity in the production of epoxy-filled parts. Deliveries were falling behind. Stress on the production floor was increasing.
The team was working flat out, but still couldn't meet customer deadlines.
They knew they had to change something. But what?
In brief
Situation: Manufacturing company with low productivity on epoxy-filled parts. Deliveries were falling behind.
Problem: Production was delivering 44 parts per hour. Capacity wasn't keeping up.
Cause: The mold wasn't holding the tubes properly in place. Overfilled tubes, wasted material and time-consuming rework.
Result: From 44 to 64 parts per hour. A 45% increase. No new hires. No overtime.
The challenge: same actions, same problem
First instinct:
"We need to work faster." "We need more people." "We need more capacity."
The team could have hired more staff. Worked overtime every day. But it wouldn't have solved the fundamental issue: the mold wasn't working.
Overfilled tubes. Wasted material. Time-consuming rework. Even when everyone was working at full capacity, quality and consistency were unpredictable.
By using structured root cause analysis, they found out what was actually creating the challenge. Then they could put in place actions that had real effect, instead of fixing the same thing over and over.
The tree metaphor: symptoms, problem and causes
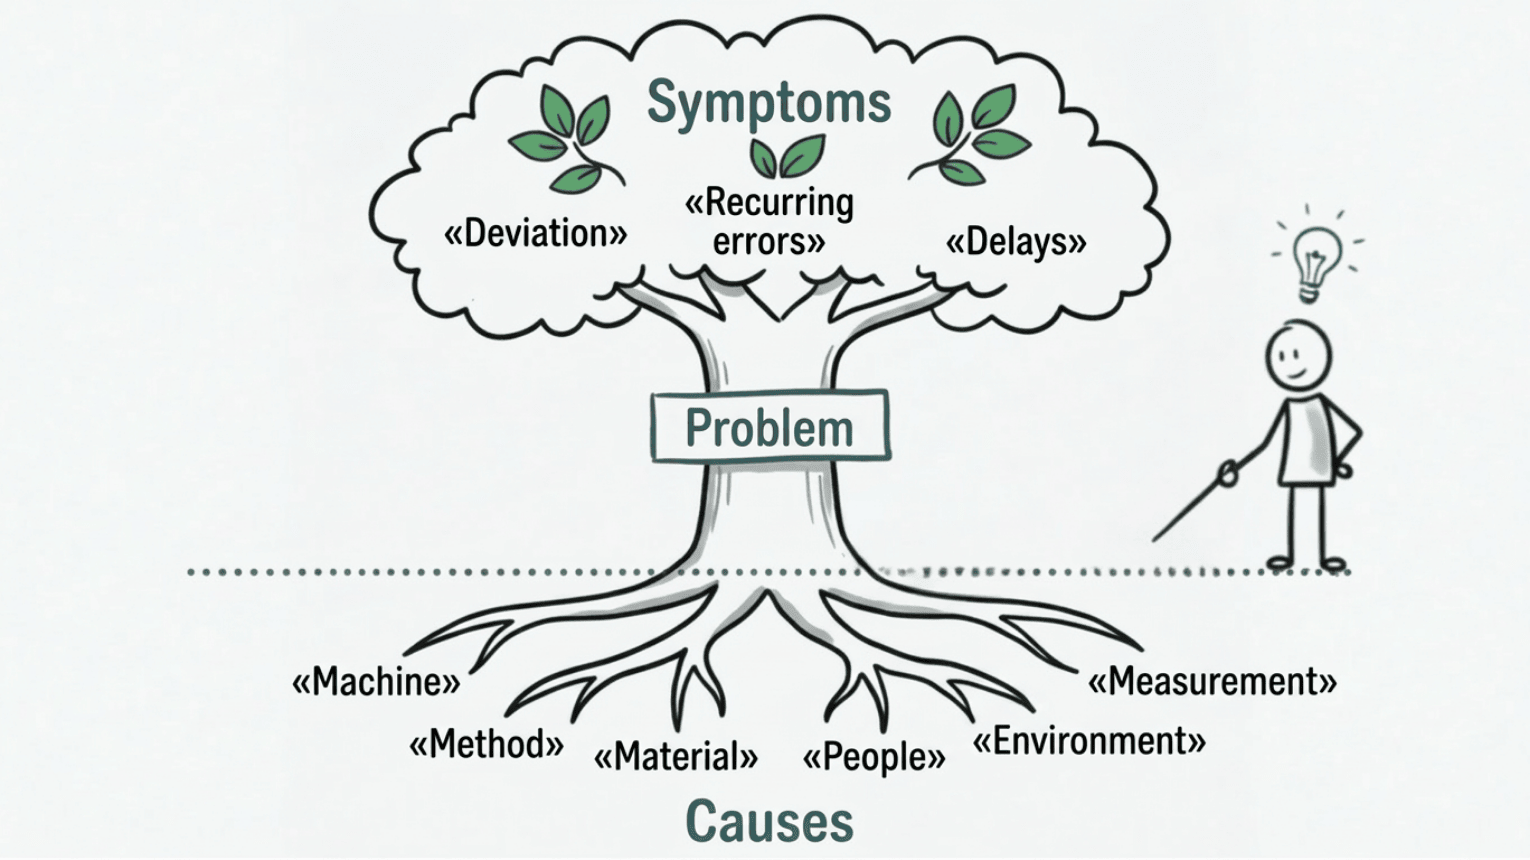
As the image illustrates, a problem (the tree) can have many causes (the roots). Over time, the symptoms (the leaves on the tree) and the problem (the tree) will grow and become more visible.
Focusing on the leaves makes it difficult to gain clarity on the problem and identify the real root causes.
For the epoxy company, the symptoms were delayed deliveries and frustrated customers. The problem was low productivity, measured in parts per hour. The cause was the mold not holding the tubes in place.
The sequence matters: First understand the problem. Then investigate causes. Finally put in place actions.
Key concepts
These three concepts are often used interchangeably. That creates confusion and leads teams to work on the wrong things.
Symptoms are what you see and experience. Delayed deliveries. High rejection rates. Frustrated customers. Symptoms are the leaves on the tree. They grow back if you don't address the roots.
The problem is the deviation from the desired state, tied to a measurable quantity. In the epoxy case: 44 parts per hour when capacity requirements were higher. Without a clear measurement you don't know what you're improving, and you don't know if you're succeeding.
Causes are the underlying factors creating the problem. They are the roots. Often invisible until you dig.
How frequently the problem occurs determines which strategy you need. Is it a one-off event or something that happens systematically? Read more in the article Carrot or Tree? Choose the Right Tool.
Understanding variation
Statistical process control (SPC) separates signal from noise. That is: it separates special cause variation from common cause variation.
This is critical for choosing the right approach.
Special cause variation means something abnormal has occurred. There is one event to trace. A linear cause-and-effect chain.
Common cause variation is the sum of all random factors in the process. No single cause. The solution requires understanding the entire system.
Critical mistake: If you react to common cause variation as if it were special cause variation, you are most likely making things worse.
Tools for root cause analysis
Here are tools that can help you with root cause analysis:
Structure the analysis:
• Mind mapping, A3 or project charter to structure the problem-solving process.
Determine variation type:
• Statistical process control determines whether common or special cause variation is creating the problem. Or perhaps it's not variation but centering that is the challenge. SPC will tell you that too.
Identify possible causes:
• Process mapping identifies possible root causes.
• 5 Whys and cause-and-effect diagram (Fishbone) identify possible root causes.
Prove root causes:
• Graphical analysis can prove root causes.
• Hypothesis testing proves root causes when graphical analysis is not conclusive.
Optimize and control:
• Correlation and design of experiments (DOE) determine optimal factor values.
• Statistical process control (control chart) monitors variation in critical variables and ensures lasting results.
Problem-solving with the FAST method
Focus: Understand the problem and establish shared focus. A problem must be tied to a measurable quantity.
Analysis: Understand variation, map the process, prove root causes with data.
Solve: Solve the root causes with actions that actually work.
Track: Monitor and secure lasting results.
Does this sound familiar?
Maybe you don't produce epoxy-filled parts. But you probably recognize the pattern:
• The same challenge keeps coming back despite multiple actions.
• The team jumps to solutions without investigating causes.
• Quick fixes are celebrated, but the problem is back weeks later.
• Every deviation triggers a reaction without knowing whether it's common or special cause variation.
• Corrective actions make the process more unstable, not less.
Resources are spent treating symptoms, not solving root causes.
What you can do
Step 1: Start with the problem, not the solution
Next time a problem appears, resist the impulse to go straight to actions. Take time to understand the problem and tie it to a measurable quantity. What is the deviation from the desired state?
Step 2: Ask the question "How often does this happen?"
Frequency determines which strategy you need. A one-off event requires a different approach than a recurring pattern.
Step 3: Prove the cause with data
Don't assume. Test hypotheses. Collect data deliberately — not all data, only what is relevant to the hypothesis you are testing.
Step 4: Put in place actions at root cause level
Actions at symptom level give temporary relief. Actions at root cause level give lasting results.
Frequently asked questions
What is the difference between a symptom, a problem and a cause?
Symptoms are what you see and experience: delayed deliveries, high rejection rates, frustrated customers. The problem is the deviation from the desired state, tied to a measurable quantity. The cause is what is actually creating the problem. Many teams work on the symptoms and think they are solving the problem. They are not. The tree grows back from the roots.
How do I know which tool to use?
Start with the question: "How often does this happen?" The answer determines strategy. If it happens rarely or for the first time, it is likely a special cause event with one clear cause. If it happens regularly, it is likely a systemic problem with many interacting factors. The two require completely different tools. Read more in the article Carrot or Tree? Choose the Right Tool.
What if the same problem keeps coming back?
That is a clear sign that the actions are hitting the symptoms, not the cause. Stop. Map the process. Ask: "What is it in the system that makes this happen again and again?" Recurring problems are almost always systemic, not one-off events.
What is the difference between a special cause event and a systemic problem?
A special cause event has one triggering cause you can trace. Something abnormal happened. A systemic problem is built into the process itself. It happens because the system is designed to produce that result. Treating a systemic problem as a one-off event is one of the most common mistakes in problem-solving, and it usually makes things worse.
When should I use hypothesis testing vs graphical analysis?
Always start with graphical analysis. It is faster and often clear enough. Use hypothesis testing when patterns are not obvious, or when you need statistical proof for an important decision.
Do I always need to go all the way to the root cause?
Not always. Sometimes symptom management is the pragmatic choice — for example when the cost of solving the root cause exceeds the benefit. But that decision should be made deliberately, after analysis. Not as a default because it is faster.
Want more stories about problem-solving?
This story is from our weekly newsletter, where we share experiences. Short stories for those who want to solve problems at the root and achieve measurable, lasting value creation.
Sign up for our newsletter:
If you want to learn more about the topics in this post:
• Learn systematic problem-solving in the Green Belt course
• Separate signal from noise with the SPC online course
• Shared Focus First: The Missing Step in Problem Solving
Assignments
Contact info
Lean Tech AS | Kristoffer Robins vei 13
0047 481 23 070
Oslo, Norway
Lean
L - Look for solutions
E – Enthusiastic
A – Analytical
N - Never give up