")


I was very impressed with Sissel's Lean Six Sigma knowledge. She makes it easy to identify improvements and create results.

Daryl Powell
Research Manager, Sintef Manufacturing

To me, Lean Six Sigma is about challenging established truths by asking questions and require facts. Questions enable us to develop and innovate.
Some questions can be perceived as criticism therefore it is important to focus on the process, not the person.
If we ask questions because we are curious and want more knowledge, the chance of being heard is greater.
An established truth within Six Sigma is that six sigma process involves 3.4 errors per million opportunities. It is an established truth that I want to challenge.
A table with the correlation between sigma levels and expected defects presented in Six Sigma training and literature looks like this (just try to google “six sigma performance table”):
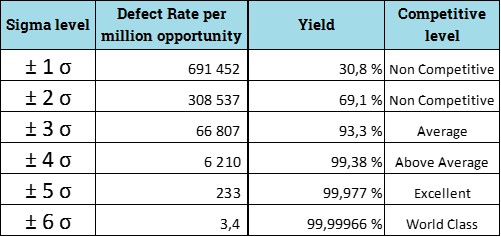
Statistical process control (SPC) uses control limits to distinguish between normal and special variation. Control limits represent ± 3 sigma (σ) and includes 99.7% of the data if the data are normally distributed.
The probability of a value outside of the control limits is 0.3% (100% -99.7%). It does not match the declared value of 3 sigma in the table, which is 66,807 defects per million opportunity. It should have been about 3000 defects per million opportunity.
So, I decided to take a closer look at this table. And to me the numbers do not make sense.
± 1 sigma includes 68.26% of the data, the probability of getting a value outside is 31.74%.
± 2 sigma includes 95.44% of the data, the probability of getting a value outside is 4.56%.
However, the probability of values outside ± 4, 5 & 6 sigma is more difficult to find. Statistical tables often state "tail area of unit normal distribution" (the probability of a value outside the z sigma level) up to z = 3.99.
I used z calculator from this website to calculate the probability of values outside ± 4, 5 & 6 sigma, resulting in the following table:
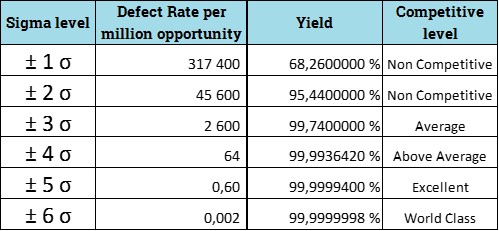 The table shows that a six sigma process can expect 2 defective per billion opportunity.
This answer is completely different than 3.4 defects per million opportunities.
How come?
I have sent my "critical question" to the International Association for Six Sigma Certification (IASSC) and Pyzdek Institute. And I look forward to their answer.
The outcome is positive no matter what.
If I am wrong, I will get an explanation resulting in new knowledge.
If I am right, I can rely on my understanding and contribute to new learning about six sigma.
Let this story remind you to keep asking critical questions.
A statement does not become true because it is repeated enough times. A statement is true if it is based on facts.
Or as Wikipedia says, "A fact is something that has really occurred or is actually correct. The usual test for a statement of fact is verifiability—that is, whether it can be demonstrated to correspond to experience."
Maybe the difference between the two tables can be explained by this definition of fact: the table I made is based on theoretical values. Maybe the other table is adjusted for based on reality?
Hopefully I will figure this out soon...
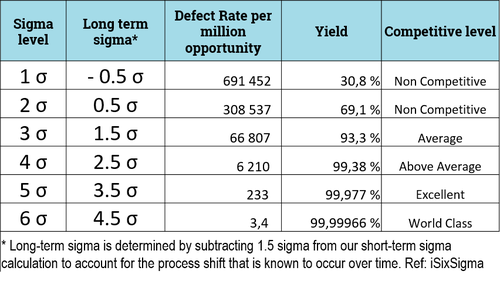
After sharing this article in a Lean Six Sigma LinkedIn group I got the answer from Jud VanWyk: The 1.5 sigma process shift, which is explained in this article from iSixSigma:
"Long-term sigma is determined by subtracting 1.5 sigma from our short-term sigma calculation to account for the process shift that is known to occur over time." If I check the z-value for 4.5 sigma, I get 3.4 defects per million opportunities. If you have a customer specification corresponding to ± 4.5 sigma (both an upper and a lower specification as I have assumed in the tables I prepared) you can expect 7 defects per million opportunities. Thank you, Jud!
Her is a table that summarize these findings (note that the table is based on one specifiaction limit, if you have both an upper and a lower specification limit you can expect twice as much defects):
I was very impressed with Sissel's Lean Six Sigma knowledge. She makes it easy to identify improvements and create results.
Very nice and professional service. Delivered a good job within deadlines.
Sissel's commitment and expertise is impressive. Her contribution to our monitoring program has been precise and targeted, as well as very educational.
We are very happy with the work carried out; with your background and expertise, the outcome was what we were looking for.
Sissel is a competent and committed employee. She has been an important contributor to ensure progress. At the same time, she is accurate and deliveres good quality work.
Lean Tech delivered monitoring program for air emission. The assignment was delivered with the correct content at the right time. Recommended.
Very engaged and focused throughout the course. Sticking to the agenda. Nice and pleasant.
Very good at keeping the right atmosphere, and at driving the participation from all the attendees.
Supply Chain & Automation Manager
"You are inspiring, positive and professionally skilled" "Made a difference, engaged and skilled"
"Inspiring, motivating and patient. Managed to adjust the subject to our level."
"Very knowledgeable. Good answers to all input."
"Excellent! Very clever and engaging"
"Great and fun with the Lego competition."
"Very good! Lots of knowledge and good at communicating."
"Good mix of theory and practice. Fun to try out what you've learned."
Very useful with practical implementation and approach, and that we could relate / transfer to our own workplace.
Inspiring, professionally competent, popularize a theoretical discipline.
Clear and well presented. Good at asking questions and listen (check understanding).
Academic highly skilled and clear performance. Fun and builds trust.
Lean Tech AS | Kristoffer Robins vei 13
0047 481 23 070
Oslo, Norway
L - Look for solutions
E – Enthusiastic
A – Analytical
N - Never give up


