")


I was very impressed with Sissel's Lean Six Sigma knowledge. She makes it easy to identify improvements and create results.

Daryl Powell
Research Manager, Sintef Manufacturing

The best way to find out is to test! You can do that at the Norwegian museum of Science and Technology.
I did an experimental design where I tested age, gender and sense (vision and hearing). My brother in law (35 years), my son (10 years), my niece (7 years) and I (41 years) were volunteers.
We measured the reaction time for sound and light.
My brother in law was a tiny bit faster than me when reacting to sound, followed closely by my son and my niece. For light my brother in law was fastest, then my son, followed by me and my niece. What does this result mean?
How much do age, sex and sense influence reaction time? What has the greatest impact?
By looking at the individual measurements it may look like men are faster than women to respond to light, and age 35-41 years is faster than 7-10 years. We reacted faster to sound than to light. For sound, it appears that the age 35-41 years is faster than 7-10 years. Are these conclusions correct?
It is easy to draw conclusions based on single measurements. Are the measurements representative? What is the natural variation?
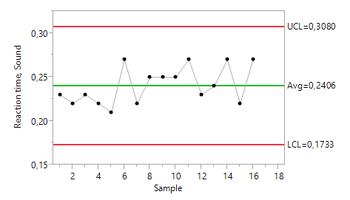
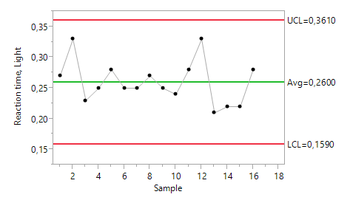
I decided to use Statistical Process Control (SPC) and Control Chart, to decide the normal variation of reaction time. I repeated the measurements of my reaction time for sound and light several times. Here you can see the Control Chart with the normal variation of reaction time for sound and light:
So what does it mean? You can expect me to use between 0.17 and 0.31 seconds to react to sound. While my reaction time to light is between 0.16 and 0.36 seconds. Average reaction time is 0.02 seconds faster for sound than light.
What about the experiment where I tested different age and gender? All measurements were within the normal variation of light and sound.
What does it mean? This means that the differences observed are not significant (it's within the normal variation). In other words, the differences are not large enough to matter.
So what is my point? It can be easy to draw conclusions based on single measurements. If you do not compare the measurements with the normal variation of the process, it is easy to draw wrong conclusion.
All processes have variation! You can determine the normal variation by taking multiple samples of the process and use a Control Chart.
So what is fastest of vision and hearing? My ears reacted a bit faster than my eyes. However, when considering the normal variation this difference is not significant.
I was very impressed with Sissel's Lean Six Sigma knowledge. She makes it easy to identify improvements and create results.
Very nice and professional service. Delivered a good job within deadlines.
Sissel's commitment and expertise is impressive. Her contribution to our monitoring program has been precise and targeted, as well as very educational.
We are very happy with the work carried out; with your background and expertise, the outcome was what we were looking for.
Sissel is a competent and committed employee. She has been an important contributor to ensure progress. At the same time, she is accurate and deliveres good quality work.
Lean Tech delivered monitoring program for air emission. The assignment was delivered with the correct content at the right time. Recommended.
Very engaged and focused throughout the course. Sticking to the agenda. Nice and pleasant.
Very good at keeping the right atmosphere, and at driving the participation from all the attendees.
Supply Chain & Automation Manager
"You are inspiring, positive and professionally skilled" "Made a difference, engaged and skilled"
"Inspiring, motivating and patient. Managed to adjust the subject to our level."
"Very knowledgeable. Good answers to all input."
"Excellent! Very clever and engaging"
"Great and fun with the Lego competition."
"Very good! Lots of knowledge and good at communicating."
"Good mix of theory and practice. Fun to try out what you've learned."
Very useful with practical implementation and approach, and that we could relate / transfer to our own workplace.
Inspiring, professionally competent, popularize a theoretical discipline.
Clear and well presented. Good at asking questions and listen (check understanding).
Academic highly skilled and clear performance. Fun and builds trust.
Lean Tech AS | Kristoffer Robins vei 13
0047 481 23 070
Oslo, Norway
L - Look for solutions
E – Enthusiastic
A – Analytical
N - Never give up


