")

Free Material
Understand variation with control charts
Learn how control charts can be used to quantify variation, including measurement uncertainty. Get practical guidance with an example that's easy to understand - bathroom scales and body weight. Sign up
Find out what affects variation.
The video shows you how control charts can be used to quantify weight variation caused by measurement uncertainty, measurement timing, day-to-day variation and week-to-week variation.
This is crucial for understanding where you should focus to reduce variation.

Control charts to determine variation.
See how control limits can be used to understand and calculate variation from different sources.
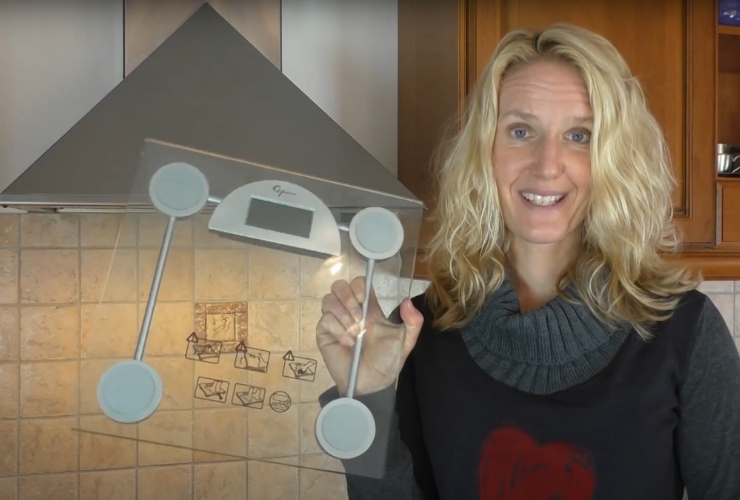
Relatable example with bathroom scales.
How much does weight vary daily, weekly, or due to measurement uncertainty?
Apply the method to your measurements.
Compare control limits to determine what affects measurement results in your processes.
Quantify variation with control charts

Ideal if you want to:
- Understand and calculate measurement uncertainty
- Use control charts to analyze variation
- Identify what affects measurement results the most
- Improve the quality of your measurements
- Focus improvement efforts where they have the greatest effect
Course feedback (Control Chart):
«Very well explained. It opened my eyes to not overreacting to normal variation and how to reduce variation.»
«Good exercises. Relevant and relatable. Skilled and engaging instructor.»
«Process mapping and control charts have helped us understand variation and work to get more robust processes.»


Course instructor: Sissel P. Lundeby
20+ years of experience with statistical methods: «Understanding variation in measurements is critical for making good decisions. Control charts make it easy to distinguish between different sources of variation and figure out where you should focus your improvement efforts. The bathroom scales example makes the concepts easy to understand before you transfer the knowledge to your own measurements.»
IASSC accredited instructor • Chemical Engineer • Black Belt since 2002