")

When and how do you respond to a result?
Do you use facts or intuition? Do your customers decide when to react?
Or maybe you use statistical process control?
How do you react? Do you start looking for a special cause?
Or maybe you review the entire process and consider factors that may influence?
It is easy to overreact to normal variation. There will always be variation present.
By knowing what is normal for a process we know when to look for a special cause, and when to work on reducing the normal variation. We tend to look for special causes and overreact to normal variation.
I weighed myself a few weeks apart. The scale showed 1 kg more than the previous weighing. Does that mean I have gained weight?
To answer this, there are many questions that must be answered first:
- What is the uncertainty of the scale?
- Were the measurements carried out at the same time? And if not, is 1 kg a significant change in weight compared to day variation?
- Was the weighing process the same? (With or without clothes and shoes, before or after a meal)
- Was it the same scale that was used?
- Is the scale sensitive enough?
Several of these questions can be answered by conducting a measurement system analysis.
Measurement system analysis
For three weeks, I weighed myself 3 times a day. At each weighing I conducted three parallel measurements.
Here is the design:
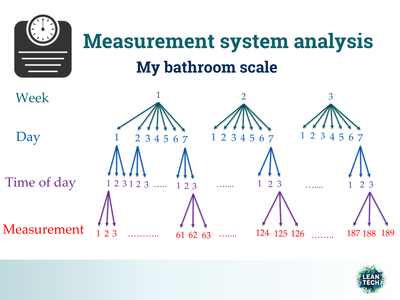
The design shows that a total of 189 measurements are performed during the three weeks.
9 measurements are carried out each day for a total of 21 days.
I weighed myself in the morning, in the middle of the day and in the evening.
At each weighing I conducted 3 consecutive measurements by stepping up and down from my bathroom scale and record the weight.
Wondering if I have too little to do? I guess I am more interested than the average in practical application of Six Sigma...
A Control Chart can be used to determine the measurement uncertainty.
Control Chart
Here is a Control Chart including the average of 3 parallel measurements:
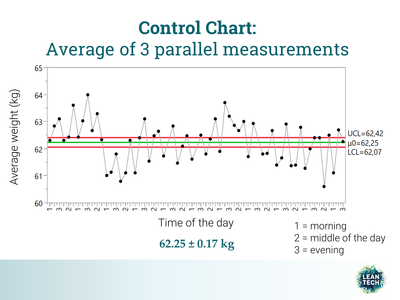
Control limits (UCL and LCL) are calculated based on the variation of the three parallel measurements.
The control chart shows that the distance from the average to the control limits are ± 0.17 kg. This represents the measurement uncertainty of my bathroom scale.
Since many values are outside of the control limits it means that there is greater variation in weight, than the variation caused by measurement uncertainty.
A measurement system evaluation can determine the percentage variation caused by the measuring instrument compared with variation in the medium you measure. It is desirable that the variation caused by the measuring instrument is low compared to the variation in the medium. It means that the measuring instrument can measure the variations in the medium. As I said before, there will always be variation present. Understanding variation is a key to success!
Here is a Control Chart with the average of the 9 measurements performed at the same day:
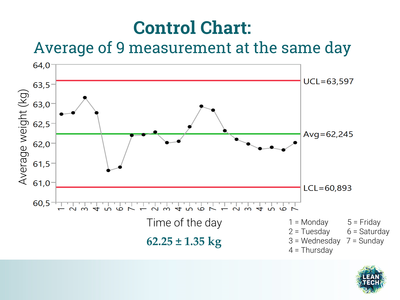
Control limits (UCL and LCL) are calculated based on the variation of the 9 measurements performed at the same day.
The control chart shows that the distance from the average to the control limits are ± 1.35 kg. This represents the day to day variation.
All the values in the control chart are within the control limits. This means there is no major difference in weight from day to day than the variation within a day.
What is the conclusion? Did I gain weight between the first and the second measurement I did, showing 1 kg more?
1 kg is within the variation observed during a day, which is ± 1.35 kg. There is no reason to overreact to this weight gain :-) It is within normal variation.


