")


Sustainability
Emission | Energy | BAT
Emission | Energy | BAT

Cost | Quality | Time

RCA | Variation | Cost - benefit

DOE | ANOVA

The amount of data we have access to is overwhelming; but what data is interesting? What data is important to reach your targets?
When implementing new production lines with data acquisition, spend resources to collect only the data you need.
Are you not sure what data you need? Use resources to decide. Here are some questions that might be of help;
Companies implementing comprehensive data acquisition can risk production downtime due to overloaded system or failure. The rule "Make it simple" applies here as well. Lean Tech can help you define goals and measure to collect the right data, and to ensure good data quality.
![]()
Collecting lots of data doesn't help if the data quality is poor. The data needs to be consistent with the data source. Ensuring good data quality can be time consuming and resource demanding. However, it's well worth it! If you do not trust your data, will you take actions based on them? If your "gut feeling" is not aligned with the data, do you trust your "gut feeling" or the data?
If you do not trust your data, it is easy to make decision based on "gut feeling" rather than the data.
Data quality can be addressed by monitoring production events during a given time; log manually all relevant events and verify that the collected data is aligned with your observations. A challenge when checking data quality is to reveal problems that occur occasionally.
Lean Tech has experience with quality assurance of data at a company that loged up to half a million data per hour from different machines. There were different suppliers involved, and extensive root cause analysis was conducted to reveal the causes of unstable data collection and missing data. In such cases it is important to obtain as much information as possible about the situation that caused the instability.

You can use excel to visualize data, or you can use more sophisticated tools like JMP, Minitab, Modde, Sigma XL or others. Lean Tech use JMP, Minitab or SigmaXL (dependent of the customers preference) for Lean Six Sigma training.
Visualization of data makes it easier to see connections and trends between different variables and data sets. There are different graphical plots that are used for different data and purposes. The course Root Cause Analysis cover this.
Visualization of data makes it easier to identify outliers in your data set and investigate these data. This is useful when controlling the quality of your data.
Regression analysis shows the correlation between various factors. Are there a correlation between the in-process controls and the final product quality? Are there a correlation between variables? Positive or negative correlation? Linear or non-linear? Can the correlation be explained?
If you have data set you would like to analyze for trends and correlation you can contact Lean Tech.
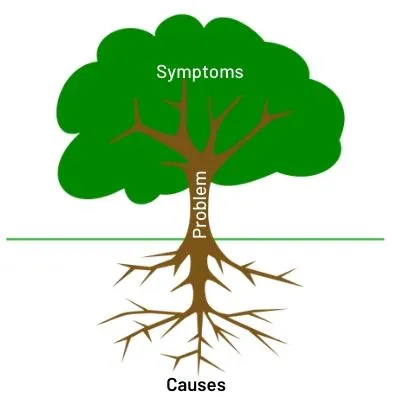
The purpose of a root cause analysis is to determine the true causes of a problem to implement targeted measures.
Lean Tech offers Root Cause Analysis training and consultancy. Here are some of the tools we use:
These tools are used within Lean Six Sigma's problem-solving method DMAIC: Define (understand problem and set goals) - Measure (map current situation) - Analyze (prove root causes) - Improve (solve root causes) - Control (create lasting results).
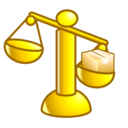
To choose between alternative solutions, cost-benefit analysis can help you make the right decision. It can be challenging to quantify the effect. It requires the ability to see the complete picture and how the change affect the overall business.
Lean Six Sigma focus on gathering neutral information and make fact-based decisions. Improvements should create bottom line results and true root causes are to be solved by choosing the best option among several alternatives. Lean Six Sigma's problem-solving method DMAIC follows these steps:
The improve phase of Lean Six Sigma identifies different solutions and prioritize based on cost & benefit of the different options. To make the right decision it's important to evaluate pros and cons of the various alternatives. Cost, effect and time are common criteria to consider when deciding. Priority matrix can help you make good decision. This is one of the improvement tools available as e-learning.
A cost benefit evaluation does not need to be 100% correct, 90% is usually more than enough to make the right decision.


I was very impressed with Sissel's Lean Six Sigma knowledge. She makes it easy to identify improvements and create results.

Very nice and professional service. Delivered a good job within deadlines.

Sissel's commitment and expertise is impressive. Her contribution to our monitoring program has been precise and targeted, as well as very educational.

We are very happy with the work carried out; with your background and expertise, the outcome was what we were looking for.

Sissel is a competent and committed employee. She has been an important contributor to ensure progress. At the same time, she is accurate and deliveres good quality work.

Lean Tech delivered monitoring program for air emission. The assignment was delivered with the correct content at the right time. Recommended.

Very engaged and focused throughout the course. Sticking to the agenda. Nice and pleasant.
Very good at keeping the right atmosphere, and at driving the participation from all the attendees.
Supply Chain & Automation Manager
"You are inspiring, positive and professionally skilled" "Made a difference, engaged and skilled"

"Inspiring, motivating and patient. Managed to adjust the subject to our level."
"Very knowledgeable. Good answers to all input."
"Excellent! Very clever and engaging"
"Great and fun with the Lego competition."
"Very good! Lots of knowledge and good at communicating."
"Good mix of theory and practice. Fun to try out what you've learned."
Very useful with practical implementation and approach, and that we could relate / transfer to our own workplace.
Inspiring, professionally competent, popularize a theoretical discipline.
Clear and well presented. Good at asking questions and listen (check understanding).
Academic highly skilled and clear performance. Fun and builds trust.
Lean Tech AS | Snøfonna 5
0047 481 23 070
Lørenskog, Norway
L - Look for solutions
E – Enthusiastic
A – Analytical
N - Never give up